Recently, I re-read some chapter of Programming Pearls about the performance tuning. For notes about detailed basic principles to optimize performance, you may like to refer to this post. In those chapters, author concludes some optimization levels to check when performance becomes a problem:
- Design level (System architecture): run in parallel, do in async way etc;
- Algorithm level: space and time tradeoff; better algorithm & ADT;
- Code tuning: loop unrolling; lock opt;
- System Software
- JVM level: garbage collector chosen; command line argument tuning;
- OS level: network config; IO tuning;
- Hardware
Now, we will apply above checklist of optimization levels to a specific project – syncer (syncer is a tool to sync & manipulate data from Mysql/MongoDB to Elasticsearch/Mysql/Http Endpoint) – to put the knowledge into practice and get better ideas about performance tuning.
Prepare Data & Env
The architecture of syncer is relative reasonable and fixed (see this blog post, if you want for an architecture overview: producer & consumer + pipe & filter), so we will skip this part. There is no complex algorithms existing in syncer, and we will also not going to dive into this. So, we will start from code tuning.
In order to do code tuning, we used some tools: to generate random data for test, to profile & tuning code.
- Go script: generate lines of CSV datas to use;
- JProfiler: a powerful tool which can profile CPU/Memory, and Lock/JDBC etc, an example usage can be found here;
- Docker: to run a clean Mysql/Elasticsearch container for testing;
After all of the preparation task (install JProfiler and start application using its Idea plugin, generate data, pull image and config MySQL binlog & ES), I start the syncer to listening the change of MySQL data and run import script to insert to & delete from MySQL.
At the main panel of JProfiler, we can see the overview of application: Memory, CPU, threads, GC activities and classes. The first thing that I notices is there existing many waiting/blocked threads.
Thread
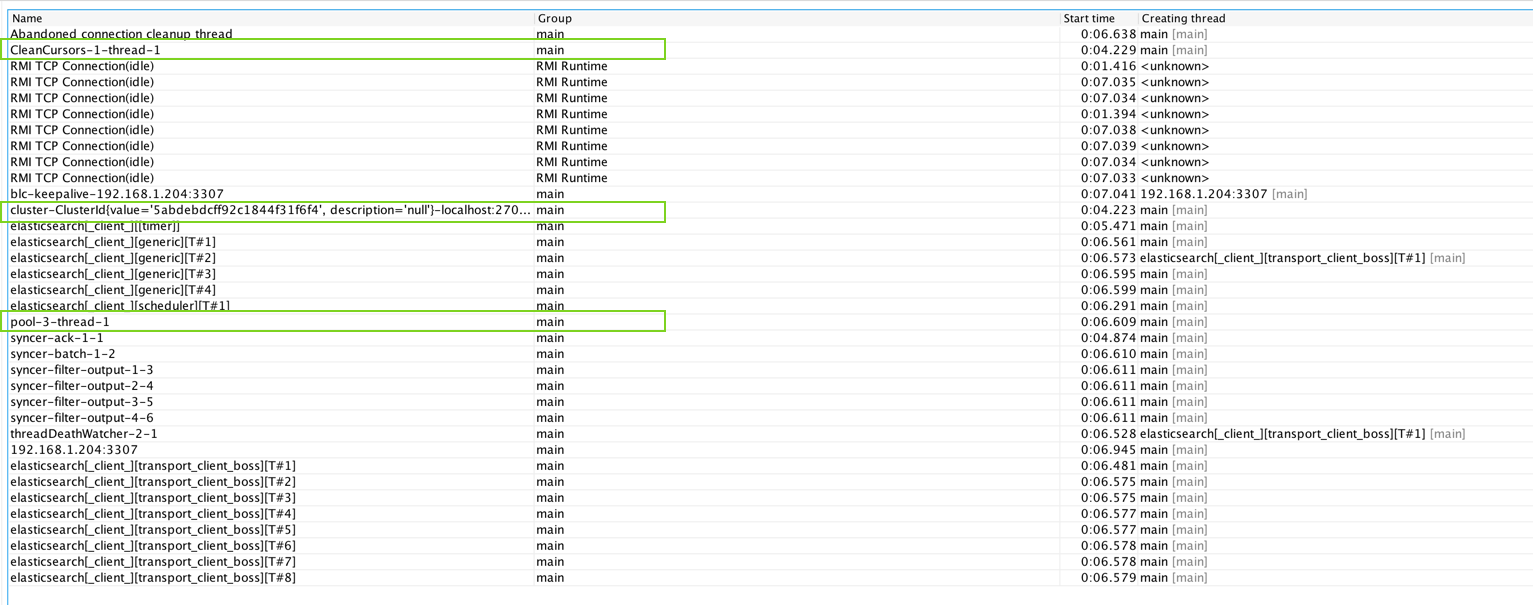
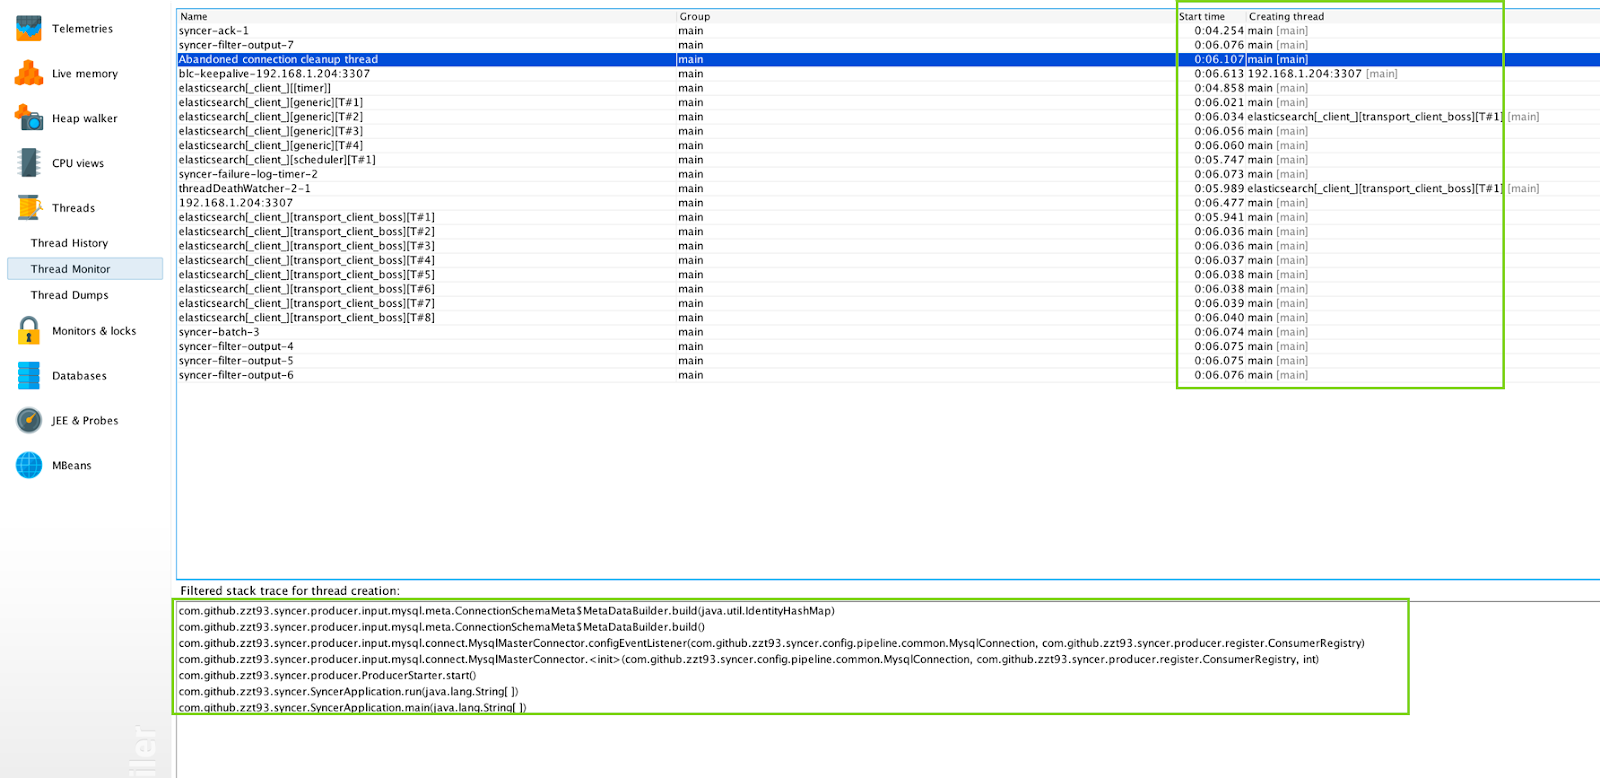
We can choose the Threads->Thread Monitor panel, then we can see the details and find some unknown threads. After some simple guess and search, we can find those threads are threads for MongoDB communication. Through the help of thread creation stack trace, we found that those threads are auto-configed by Spring Boot accidentally (So, we exclude those auto config and save those resources).
Besides this, we also find some thread with bad naming – pool-3-thread-1, and adding a customized thread factory fix the problem.
GC & Memory
Sometimes later, we noticed that the memory usage is very high and GC activity rate is over 90%. Soon, the application crashed with:
Exception in thread "blc-192.168.1.204:3307" java.lang.OutOfMemoryError: Java heap space
Wondering whether there exists some kind of memory leak, we enable the GC logging with the following flags, we can see many Full GC happening:
java -verbose:gc -XX:+PrintGCDetails -XX:+PrintGCTimeStamps

8.484: [Full GC (Metadata GC Threshold) [PSYoungGen: 9524K->0K(190464K)] [ParOldGen: 9644K->14355K(138752K)] 19168K->14355K(329216K), [Metaspace: 34387K->34387K(1079296K)], 0.0434990 secs] [Times: user=0.10 sys=0.00, real=0.05 secs]
PS stands for Parallel Scavenging for young generation and ParOldGen means Concurrent Old Gen (Mark Sweep) GC. In order to view the details of heap usage and allocation to see where is the bottleneck, we need to use JProfiler’s Heap walker tab (Notice the Live memory tab can only see the objects & allocation call related information, but not the reference relationships).
After taking a HPORF heap snapshot, we found a memory usage table. Use the reference analysis of JProfiler, we found that many SyncData item is stored in queue between the input and filter module. This means there is no real memory leaks, but exists some performance problem, which leads to memory problem.
So, we do the following checklist:
- Check output speed: is Elasticsearch has too much index & shards?
- No real memory leak, but can we reduce memory footprint?
- Performance problem:
- Why slow: data input rate fast then handling speed
- Solution: Increase handling speed
Opt Memory
-
Reduce map size: we found some used map, which can be initiated when necessary;
-
Exclude not used thread: like above description.
-
Use shared var when possible: we reuse an object without state rather than initiate every time.
- Reuse & release
StandardEvaluationContext: we useThreadLocalto share the context when possible to save allocation; we release context when evaluation finished to release memory earlier (rather than waiting to send to output target).
- Reuse & release
-
Opt data id length: we found
Stringoccupy many memory and we follow the reference finding theidfield. In order to save the memory, we change the encoding ofidand save aboutidlength.
Through many small optimization, we finally reduce about 50% of memory usage when do pressure test.
CPU & Speed
In order to improve speed of event handling, we need to find the hot spot first. We first need to start CPU recording, then we can see hot spots method in CPU views -> Hot Spots:
By sorting the methods via Average Time, we can easily find target, then we click to see where those methods is called and make some optimizations:
Arrays.toString(..): Test level before log large entity (By the way, use a lambda here may be better, butslf4jis not supported for the time being):
if (logger.isDebugEnabled()) {
  logger.debug("Receive binlog event: {}", Arrays.toString(someArray));
}
Event.toString(): Log without calltoString()to avoid method invocation if log level doesn’t met;ArrayList.ensureCapacityInternal(..)- Init
ArrayListwith size rather than grow and copy; - Replace
ArrayListwithLinkedList;
- Init
SpelExpressionParser.parseExpression(..): Not parse expression every time, reuse parse result;
Conclusion
Through a serial of performance tuning, we finally decrease the memory usage about 50%, and improve 75% output rate. Hope it is helpful to you also.
Ref
Written with StackEdit.


评论
发表评论